
Brodie Waddell
[UPDATE 08/09/15: Please read the updated and expanded version of this post here.]
On August 24th, Matthew Lyons published a piece in History Today on ‘the plight of early career researchers’. Reading the comments there, on twitter and on other blogs, it is clear that he hit a raw nerve.
As commentators pointed out, some of his assertions were unfounded (e.g. ‘many if not most academics disdain teaching’, ‘[ECRs] are offered no career development or pastoral support’). Nonetheless, his claim that newly-minted historians tend to struggle rings true. Between us, the four heads of the many-headed monster have had plenty of experience with job insecurity, poorly-paid positions, forced transience, bad working conditions and other early career problems.
However, a post from William Whyte – a historian of universities – made a very good point: there is nothing new about claims of a ‘crisis’ in academic employment. We need to be careful not to slip into nostalgia for a lost ‘golden age’ when there were jobs aplenty. As historians, we should be particularly critical of ‘fundamentally presentist, ahistorical – indeed anti-historical – peddling of myths’.
In the interests of bringing a bit more ‘history’ to this discussion, I tried to dig up some ‘historical’ data on PhDs, students, and jobs. Before going further, I should point out we should not simply assume that academic jobs for new PhDs are a ‘Good Thing’. We should not neglect the contributions of people with historical training to non-academic fields (e.g. Alt-Ac jobs) and the value of doctoral study to people from all walks of life, irrespective of their career goals. Moreover, just looking at the raw numbers ignores the ‘quality’ of the jobs, including working conditions and casualisation. Still, I wrote a post awhile ago giving advice to those thinking about doing a PhD in history, and thought some data might be a useful addition to this and a contribution to the wider debate about ECRs.
The Higher Education Statistics Agency (HESA) has data from 1994/95 to 2013/14 on completed PhDs, undergrad student numbers and much else. (Thanks to Sharon Howard for the link to HESA data.) Unfortunately, they do not have earlier data and their figures for staff numbers are very messy. In addition, even their basic figures on PhDs and undergrads is not entirely consistent thanks to changes in definitions and measurements (notably in 2002/03 and 2007/08), so what follows should be taken with a large grain of salt. Finally, the data is not recorded in single simple file – instead it is spread across about forty different spreadsheets and PDFs, each of which I had to manually check. I may well have made some mistakes: let me know if you spot any.
So, how many PhDs in History are granted each year? I don’t know. Unfortunately HESA’s changing definitions mean that it is not possible to get consistent numbers on this. Instead, I found ‘historyish’ doctorates, which means ‘Historical and Philosophical Studies’ (history, archaeology, philosophy, theology, heritage studies, other historical and philosophical) for 2003-2014 and ‘Humanities’ (history, economic and social history, history of art, history and philosophy of science, archaeology, philosophy, theology, other humanities, combinations) for 1995-2002. By this measure, there were 1,235 doctorates granted in 2013/14, over three-times the 389 granted in 1994/95. The largest increases were c.1995-2001 and c.2008-2011.
 How many jobs were there for History PhDs? I don’t know that either. The American Historical Association has tracked job ads since the 1970s, but there doesn’t seem to be an equivalent for the UK. If the Royal Historical Association, the IHR or perhaps jobs.ac.uk have any numbers, I’d love to hear about them. However, HESA does have numbers for students taking ‘Historyish’ degrees. I focused on new full-time undergraduates, as I thought that would provide a very rough approximation of ‘demand’ for new PhDs. Of course this ignores the fact that universities do not simply hire in response to student numbers: sometimes they hire for research (especially near REF), they sometimes increase enrolments without increasing staff, and they sometimes hire based on other sources of funding. Still, the student numbers are all I’ve got for now. There were 10,832 first-year historyish students in 1995/96 and there were 21,160 in 2013/14, a two-fold increase. Here the biggest increases date to 2002/03 and 2007/08, but this was also when HESA’s definitions change, so this may spurious. (For earlier total student numbers, see ‘Education: Historical Statistics’ 2012 parliamentary report and the 1997 Dearing Report)
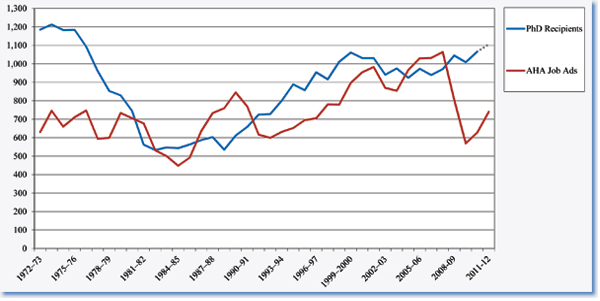 For comparison, above is the figure for PhDs in History in the United States and the number of job adverts each year, taken from the AHA’s 2012 Jobs Report. The more recent Jobs Reports I found (2013 Report and 2014 Report) don’t include such clear numbers, though they’re still useful in showing the lack of recovery from the major decline at the start of the recession in 2008/09. There is also a more recent analysis from the American Academy of Arts & Sciences of job ads in a range of arts and humanities disciplines for 2001-2014 that confirms the collapse in opportunities. (I couldn’t find any figures for Canada, but I did learn that only 30 percent of Canadian humanities PhDs end up in academic positions.)
In the UK, the ratio between new undergrads and completed PhDs may provide a very, very rough proxy for the state of the job market for historians. A high number indicates more BA students per PhD (and thus perhaps stronger demand) whereas a low number probably indicates lower demand. The ratio of new undergrads to completed PhDs declined from about 28:1 in 1994/95 to 17:1 in 2013/14, a fall of almost 40%. My suspicion is that this actually underestimates the decline as the large increase in 2002/03 is probably due to HESA’s changing definitions. If we look at each statistically consistent period individually, we see a 54% decline from 1994/95 to 2001/02, a 7% decline from 2002/03 to 2006/07, and a 20% decline from 2008/09.
If my suggested relationship is correct, the job market has become significantly worse since 2009/10 and much worse since 1994/95.
 So what does this all mean? Well, I don’t think its good news, but I’d like to hear what you think.
Data
I’ve put the raw numbers used for the charts above (and some other data) in a spreadsheet: Historyish doctorates and UGs, 1995-2014. Feel free to take a look and alert me to any mistakes or suggest additions.
Recent pieces on early career historians
(Let me know if there are any I’ve missed or any new additions)
Matthew Lyons, ‘Young academics: The great betrayal’, History Today, 24/08/15
Anne Holdorph, ‘Why I don’t feel betrayed by academia’, 24/08/15
Catherine Fletcher, ‘Have young academics been betrayed?’, 25/08/15
Jessica Meyer, ‘Mileage may very’, Arms and the Medical Man, 26/08/15
Anon., ‘Don’t Call It Lucky: A Personal Perspective on the ‘ECR Debate’’, History Lab Plus, 26/08/15
J. Saunders, ‘The debate in History over early careers’, Fighting Against Casualisation in Education, 03/09/15
Rachel Stone, ‘Cambridge PhDs: a cohort study’, Magistra et Mater, 20/09/15

Posted to History Matters Group on Facebook https://www.facebook.com/groups/hmblackteachersnetwork/
Thanks for spreading the word, Michael. I think its something anyone thinking about doing a PhD needs to consider.
Excellent post. Some figures that might be useful, but only loosely:
HEFCE, in their contextual data for REF2014, said there were 2011 FTE staff in the 83 HEI institutions that submitted to sub-panel 30 (History) in October 2013. 1785.8 of these were submitted. Obviously this massively under-estimates the number of historians there are. It leaves out an awful lot of HEIs who didn’t submit to this panel. Also, it masks the historians in the HEIs that did submit who are are on teaching only contracts. See https://www.hesa.ac.uk/ref2014
In RAE1996, there were 1629.9 people submitted to the history sub-panel. As each grade came with a letter depending on the proportion of staff submitted, I’ve roughly estimated that they were counting 1890 staff – from a much larger number of HEIs submitting. See http://www.rae.ac.uk/1996/1_96/t59.html
We can say that in 18 years, the number of FTE historians assessed for research has grown by less than 10%.
What could be done is to compare a cross-section of Depts from both REFs, to see how much they have grown. My suspicion is they would have grown much larger.
OK, so I’ve now done this across 75 Institutions (basically those that were in both 96 and 14 exercises, so this excludes mergers etc)
In 1996, they submitted 1449.3 FTE historians.
In 2014, they submitted 1718.98 FTE historians
This is around 16% growth
In 1996, a rough estimate is that HEFCE thought there were 1647 FTE historians in these 75 institutions eligible to be submitted.
In 2014 it was 2023.2 FTE historians.
This is around 19% growth.
Given the way I’ve estimated the 1996, this may be an over-estimate. And certainly there were more historians in these HEIs in 2014 as the figures only include people on contracts involving research. So I’d be pretty confident that, across these institutions, the number of employed historians has grown by over 20%.
Thank you for investigating these numbers, Matthew! That really helps to contextualise my figures and may help to illuminate casualisation, which – as Catherine Fletcher rightly noted – isn’t really addressed by my stats. I’ve gone back to check the more specific figures for history (rather than ‘historyish’) PhDs and undergrads for 1995/6 and 2013/14, and we can now see them all together. There were 239 PhD in history obtained in 1995/6 and 625 in 2013/14, and there were 18,260 full-time undegrad students in history in 1995/6 and 37,235 in 2013/14.
To put this as bluntly as possible, between 1996 and 2014:
– the number of research-active university historians grew by c.20%
– the number of full-time BA students in history grew by c.100%
– the number of PhDs granted in history by c.160%
If these numbers are even very roughly accurate, for every securely employed historian there are now many more undergraduates and many more new history PhDs.
Thanks for this. Clearly we need much better data, and I wonder if we should be pushing the IHR or the RHS to start monitoring this? I’d also be interested to know what the average length of time between completion of PhD and securing of a permanent post is and whether that has changed over time. In other words, do we need to start thinking of ‘early career’ not in terms of 3-5 years post PhD, but as ‘period between PhD and permanent post’?
Very good questions, Julie.
Perhaps monitoring is something HistoryLab and HistoryLabPlus could push for? The AHA sets a good example here with their yearly ‘Job Reports’.
Regarding the nature of ‘early career’, I agree that it would probably be much more logical to define it as you suggest. In fact, I think ‘early career’ doesn’t really make sense any more. Personally I think people on temporary contracts (whether just out of their PhD or a decade later) should be eligible for ECR-like schemes, whereas people like me (who are within the ECR window for some things, but now holding a permanent post) should not. Of course, then some institutions would probably try to game the system by putting more people on temp contracts.
Brodie, excellent post. Thanks.
If I may add a point, one thing that seems to be ignored in this debate is that history and academic history are not synonymous. Increasingly it is possible to be a scholar and not an academic, and there are quite a few historians with a doctorate (or two) operating independently of academic institutions. The use of digital cameras now means one can photograph freely as many documents in TNA in a week as could be transcribed there in a year in the nineties. JStor does wonders. Online book finders make finding resources easy. Independent historians can do the job without the need of departmental research expense accounts and access to research libraries, and the burgeoning public interest in history means there are more jobs and book-writing opportunities outside HE than ever before. I bet the rise in historical publications has been even bigger than the rise in PhDs. It is not all doom and gloom – unless you are wedded to a career that is exclusively university-department-centred.
Thanks, Ian. Yes, I agree that history and academic history should never be conflated. This is something that I and other contributors to the History from Below and Voices of the People symposiums banged on about at length. I’m not sure it has been ‘ignored’ in the ECR discussion (see, for example, my fourth paragraph above, and the great posts/tweets from Catherine Fletcher, Gaby Mahlberg and others), but it should certainly be highlighted whenever we are talking about PhDs, ERCs and jobs.
My only question is whether it is actually ‘increasingly’ easy to make a living as an ‘independent scholar’? I’d like to think so, for all the reasons you mention, but I haven’t seen any concrete evidence. Perhaps there’s a listing of sales of trade history books that would give some idea of the number of people who could support themselves though historical writing? What would be your guess as to the proportions of academic historians to professional non-academic historians?
Reblogged this on Concierge Librarian.
The golden years for the recruitment of lecturers with recently acquired doctoral degrees was in the period after the creation of the new universities post-1962. This period came to an end with the sterling crisis of 1967 when the Labour government led by Harold Wilson had to implement cut-backs in higher education and elsewhere. As a result, postgraduate historians reaching the end of their studies at that time faced not just a much more competitive market but also the existence of a block of recently appointed historians eager not to face comparison with younger scholars. This blockage in the profession lasted into the 1990s. I would suggest that that decade was not a particularly good one for the creation of new posts or for an influx of newly minted holders of doctorates.
Thanks for sharing your knowledge of earlier trends, Christopher. Since posting the initial analysis, Matthew Grant has pointed me towards some earlier numbers, so I’ll try to work through those and update with some longer-term trends.
Thanks very much for this; it’s very useful. I did some analysis of the figures up to 2005 a few years ago (https://magistraetmater.wordpress.com/2009/01/10/the-over-production-of-medieval-historians-5352785/), based on statistics from the IHR Making History website (http://www.history.ac.uk/makinghistory/resources/statistics/) and at that point there didn’t look to be an overproduction of PhDs relative to jobs. The IHR data is based on their History Theses and Teachers in History publications, so may slightly underestimate numbers of both, but will be nearer the figures for those studying pure history than the ‘historyish’ data that HESA has.
Given that the IHR is still producing these lists, it might be worth HistoryLab+ seeing if they could get hold of the underlying data for recent lists easily, so they (or we) could crunch that.
Thanks immensely for sharing that post, Rachel. I hadn’t found the IHR data before: it seems very useful (if perhaps a bit less reliable than HESA data) and I’m going to put together a new post using some of the ‘teachers’ figures from there as well as some of the earlier numbers in order to get a better long-term picture.
Very interesting to see the figures on medievalists specifically. I haven’t even attempted to think about sub-fields, but I suspect you’re right that some are fare better (e.g. digital, global, medical) than others (pre-modern, European).
Thanks Brodie, this is a really interesting post, and there are also some very interesting comments in the thread above. I haven’t done any work on this, and I don’t have any statistics to share, but I have a few impressionistic observations that may impact on the discussion.
The first is: I wonder what impact the changing funding provisions for postgraduates has on these figures. Back when I decided to opt for postgraduate study, I could apply centrally to the then AHRB for masters funding, and again to the newly-renamed AHRC for PhD funding. Now of course MAs are no longer funded by the AHRC, and AHRC PhD funding is devolved to regional consortia; my sense is that there is much less of it about even than there was ten years ago, although funded places have always been fiercely competitive. Is there any significant correlation between the length of time between finishing the PhD and attaining a permanent academic post, and the way in which the PhD was funded, I wonder? Such a correlation would be entirely unfair, as the method of funding is no reflection of the quality of the work undertaken, but it might be something for prospective students to bear in mind from the outset.
Secondly, I think we also need to bear in mind the changing demographics of postgraduate education. Anecdotally, it seems to me to be the case that a far higher proportion of MA and PhD students are mature students, perhaps returning to HE after a long and successful career in another sector. These are recent retirees or semi-retirees, interested in study for its intellectual rewards, and with no intention to enter into the academic jobs market. If this really is – as I suspect it is – a signficant and increasing trend, it suggests that we ought to be cautious about taking gross figures of new PhDs as an index of increasing competition for academic jobs. I’m not saying that that pressure is not there – just that it might be slightly less than the raw figures initially suggest.
Good points, Jonathan. I hadn’t thought about the impact of postgrad funding. Mine funding was directly from Warwick, so I didn’t really think much about AHRC, etc., but I’m sure you’re right that these changes would have a significant influence on the numbers of PhDs being produced.
The importance of mature and/or part-time PhDs is something that did occur to me as we have a large number of those at Birkbeck, but I’d assumed that the proportion would be fairly stable over time. In order to check, I went back to the HESA data and looked at a few sample years since the change in subject coding (2002/03, 03/04, 08/09, 13/14). They don’t have age stats at the subject level, so I just looked at full-time vs. part-time on the assumption that most students doing PhDs without aiming for an academic career would be part-time. What I found was that instead of a shift from FT to PT, there was actually a shift in the other direction. In 2002-04 there were more postgrads doing ‘research degrees’ in History part-time (c.2,300) than full-time (c.1,500). By 2008/9 this had reversed (1,100 PT vs 2,045 FT) and the balance seems to have stayed roughly the same in 2013/14. So, unless I’m misinterpreting something, there has actually been a major fall in the number of people doing PhDs in History part-time and, presumably, a similar decline in the number doing PhDs pure for its intellectual rewards. This means that the competition for jobs is, if anything, understated by the rising raw number of new PhDs, as a larger proportion of them are now likely seeking academic employment.
Thanks Brodie, those figures are really fascinating. I’d be reluctant to assume an automatic link between part-time study and mature students – an increasing amount of this demographic have the time and funds for full-time research – but you do illustrate a powerful trend.
Reposted from a discussion on Facebook…
Dan Greenfield: Interesting analysis – there’s another factor that appears to be missing however. Lets say 10 PhDs graduate each year, and there are 10 jobs on offer each year. That sounds good but actually they may be dominated by 1-2 year temporary positions. A permanent position may be found on the 3rd-6th job. So actually to accommodate those 10 PhDs you need 30-60 jobs on offer each year unless the post-docs leave academia to make room for the PhDs. So the graph also needs another data item which is how many jobs on average are taken before a permanent position is found. I would believe that historically this used to be much lower than it is now. Alternatively you can graph job ads that are permanent positions, i.e. exclude all temporary positions. Then you would be comparing the rate of incoming PhDs to the rate of (outgoing from the job-hopping market) permanent positions, making it more representative of the long-term trend for career prospects.
Brodie Waddell Good point, Dan. I agree that the ratio of new PhDs to new jobs is a partial view at best. As I explained in the post, in the UK we don’t even have solid figures for number of jobs, so that makes drawing any conclusions difficult. However, Matthew Grant provided some figures of total number of research-active historians in 1996 and 2014 (via RAE and REF returns) which shows that that number is growing much more slowly than the number of new BA students and much, MUCH slower than the number of new PhDs. Perhaps the gap between the large number of new BA students and small number of new research-active historians is being filled by temporary, casualised jobs for the larger number of new PhDs?
Dan Greenfield: Regarding research-active historians, that sounds interesting. I think the category of “research-active historians” at least sounds like it might already include those in temporary employment. If you take your typical history department, just think about what proportion of those research-active historians are in permanent positions, and I think you can extrapolate accordingly.
Brodie Waddell: Yes, ‘research active’ (for RAE/REF purposes) often includes temporary staff, including me until recently and several of my colleagues. Ultimately, I think this is something that our professional bodies (the IHR and/or the RHS) are going to have to start monitoring as right now we simply don’t have the numbers.
I would be slightly concerned about defining ECR as ‘not in a permanent position’. Some very lucky few of us have made careers of temporary contracts that have also allowed us to move up the salary and seniority ladder, something that is also demonstrated in our track records (ie number of publications, grants held etc). I personally am no longer and don’t want to be seen as early career, despite never having a permanent job, and I don’t think it would necessarily lead to fair competition.
Very true, Katie. Thanks for reminding me of that. I also know a few colleagues who have settled into rolling contracts very nicely and we shouldn’t assume that ‘permanent’ is perfect any more than ‘temporary’ is disadvantaged.
Pingback: Students, PhDs, historians, jobs and casualisation: some data, 1960s-2010s | the many-headed monster
Pingback: Whewell’s Gazette: Year 2, Vol. #08 | Whewell's Ghost
Pingback: Jobbing Historians: Tales from the Blarchive | the many-headed monster