
Brodie Waddell
Amid yet another year of university strikes in the UK, the Higher Education Statistics Agency has released the latest data on staff and degrees granted. A couple of years ago, I used this data to try to get a sense of the job market for historians, so it seems like a good time to use the new figures to provide an update.
First, let’s take a look at what’s happening in the USA, where they are able to provide a more rigorous view of the job market because the American Historical Association tracks job advertisements and provides an annual report. In previous years, the AHA reports had been published with a Chart of Doom which showed the catastrophic collapse of job openings relative to degrees granted:
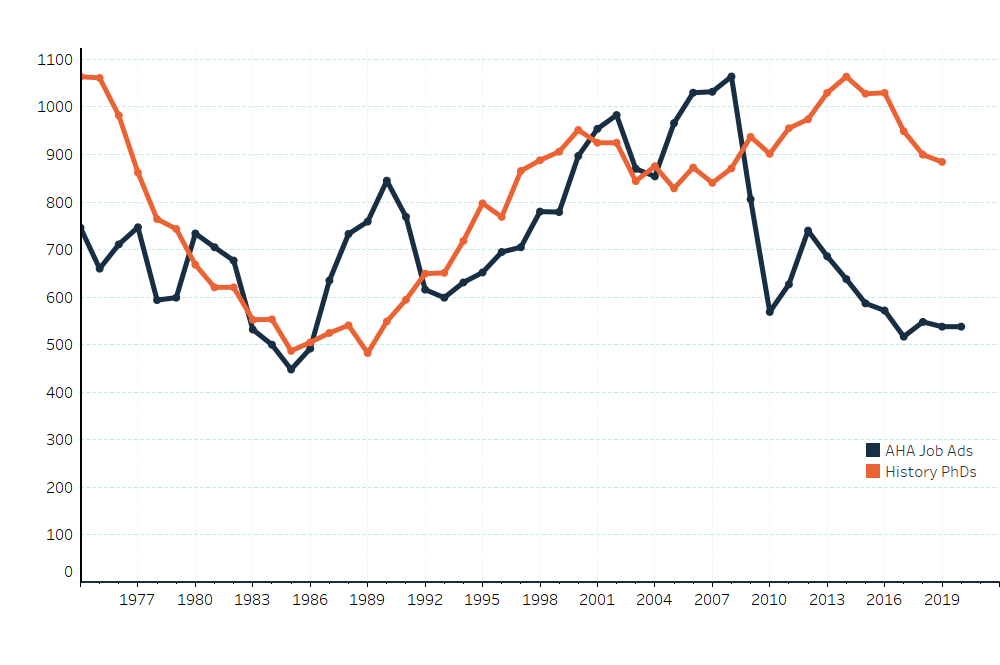
Advertised job openings and new history PhDs awarded: AHA Jobs Report 2021.
In their most recent report, from August 2022, they decided not to publish the Chart of Doom and instead have presented the information about job openings over a more short-term timescale, with more details about the types of jobs advertised. This is very useful information, though it does elide the massive drop in jobs that happened just before the chart starts in 2016-17. In the most recent year, 2021-22, they show ‘academic job listings did indeed rebound to levels above those seen immediately before the pandemic. This increase is not, however, a sign of renewed vitality but a partial return to the steady but dismal state of faculty job availability in the late 2010s.’
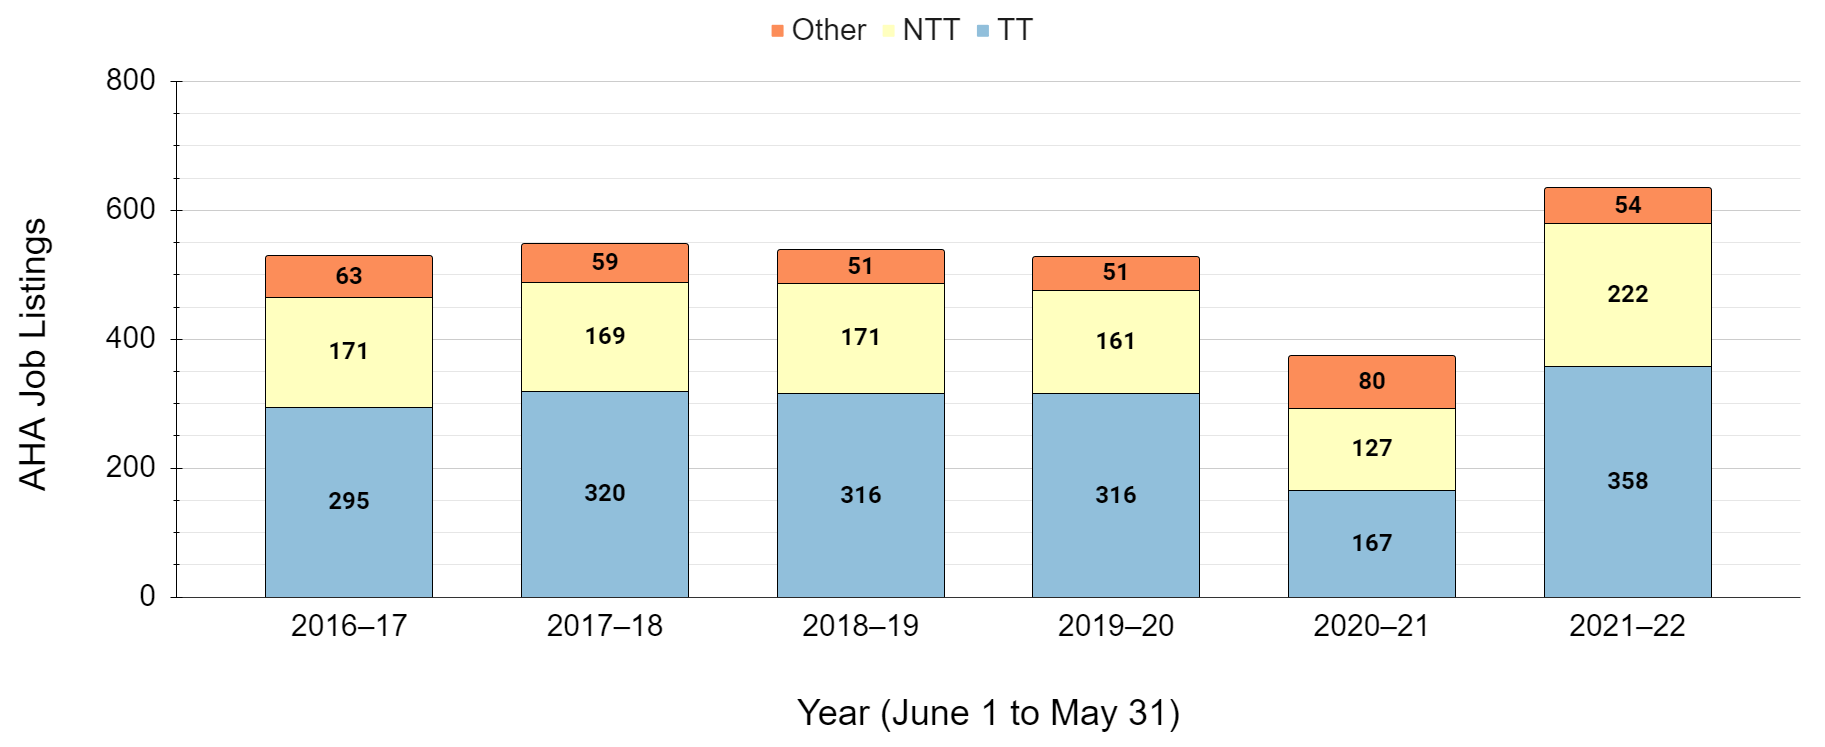
Job listings on the AHA Career Center by type and year from 2016–17 to 2021–22: AHA Jobs Report 2022.
Meanwhile, in the UK, no institution systematically collects information about academic job adverts. With some help from Andy Burn, I attempted to collect this data from jobs.ac.uk for a couple years and published the results for 2015-16, but I don’t have time to do that with more recent data. Instead, I’ve made use of the HESA data to simply track the number of staff employed in History departments in UK universities and compared this to the number of PhDs granted in History. This provides a rough sense of levels of employment (demand) in relation to the likely number of qualified candidates available (supply). In the most recent data, released in February 2023, HESA provides numbers for the 2021-22 academic year.
The headline is that the number of staff employed to teach history in universities has declined yet again, though less dramatically than in 2019-20 or 2020-21. Staffing fell by 1 percent last year, whereas it fell by an average of 8 percent in the previous two years. This is obviously not ‘good’ for historians from any conceivable angle, but it is ‘less bad’ which might be the best we can hope for in the current hostile environment.
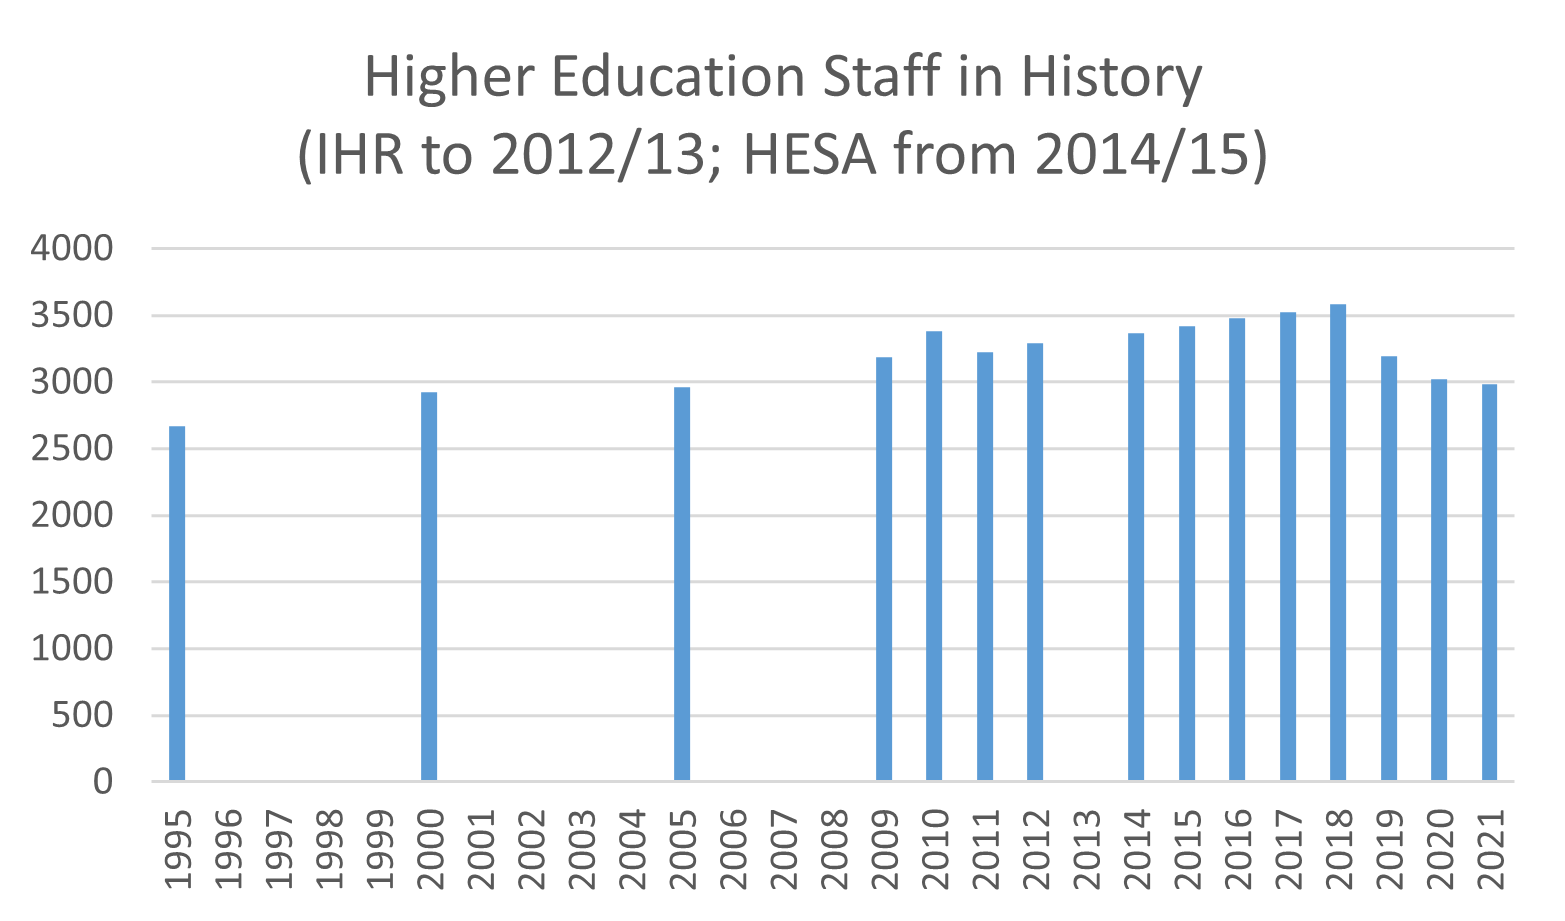
Historians in UK universities, 1995/96 to 2021/22
The other headline is that the number of PhDs granted increased substantially in 2021-22. After several years of declines from 2017-18 onwards, this trend reversed last year, with 5 percent more PhDs in History awarded. This is obviously wonderful in the sense that there are now more people with extraordinary knowledge of the past and the skills to share it with the world. However, from the practical perspective of the job market, a higher supply of historian labour is not good for those seeking jobs.
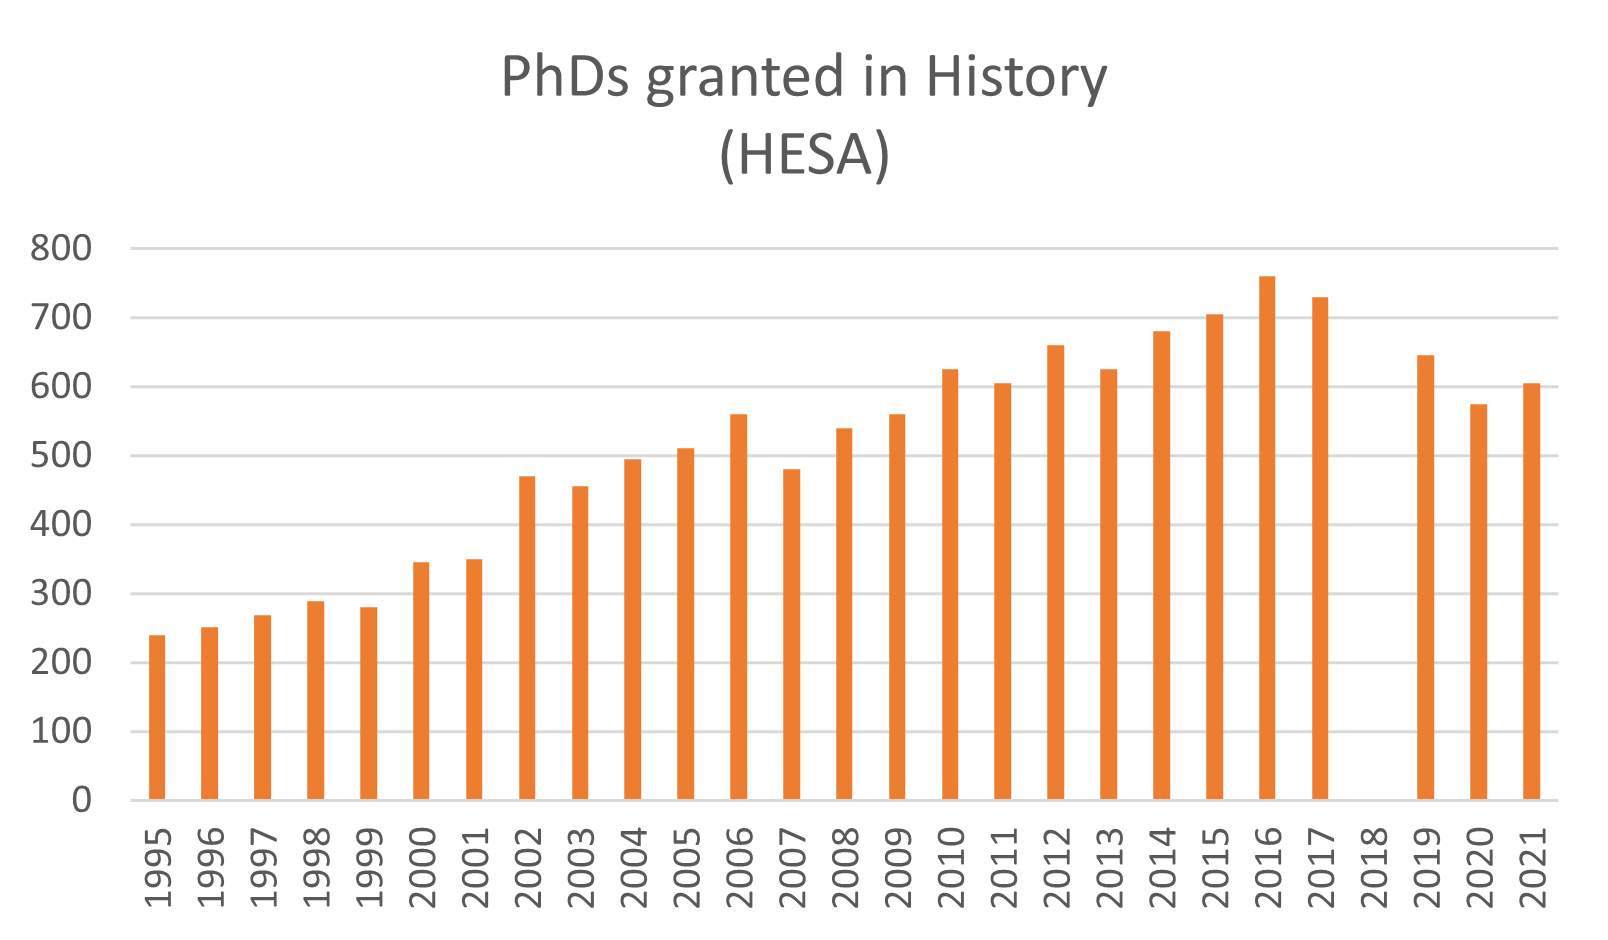
PhDs in History awarded by UK universities, 1995/96 to 2021/22
This brings us to the ratio of current staff to PhDs awarded. This doesn’t measure quite the same thing as the AHA Chart of Doom, as we don’t have data for UK job adverts. Instead it is a snapshot of the total number of historians employed by universities, divided by the number of new PhD holders each year. So, at the moment, there are about five staff employed for every PhD granted per year. The specific number probably isn’t that meaningful, but its rise or fall should be a decent proxy for the rise or fall in the job prospects for doctoral candidates. If the number of staff shrinks, as it did in 2021-22, that means universities are not doing much hiring. If the number of PhDs grows at the same time, that means there is a growing number of candidates for a smaller number of jobs.
This ratio has been fairly stable over the last decade or so, after dramatically worsening between the mid-1990s and early 2010s. In 2019-20 and 2020-21 it actually improved very slightly. However in the last academic year it has worsened yet again, meaning that there are now fewer employed university historians per PhD than in the previous couple years.
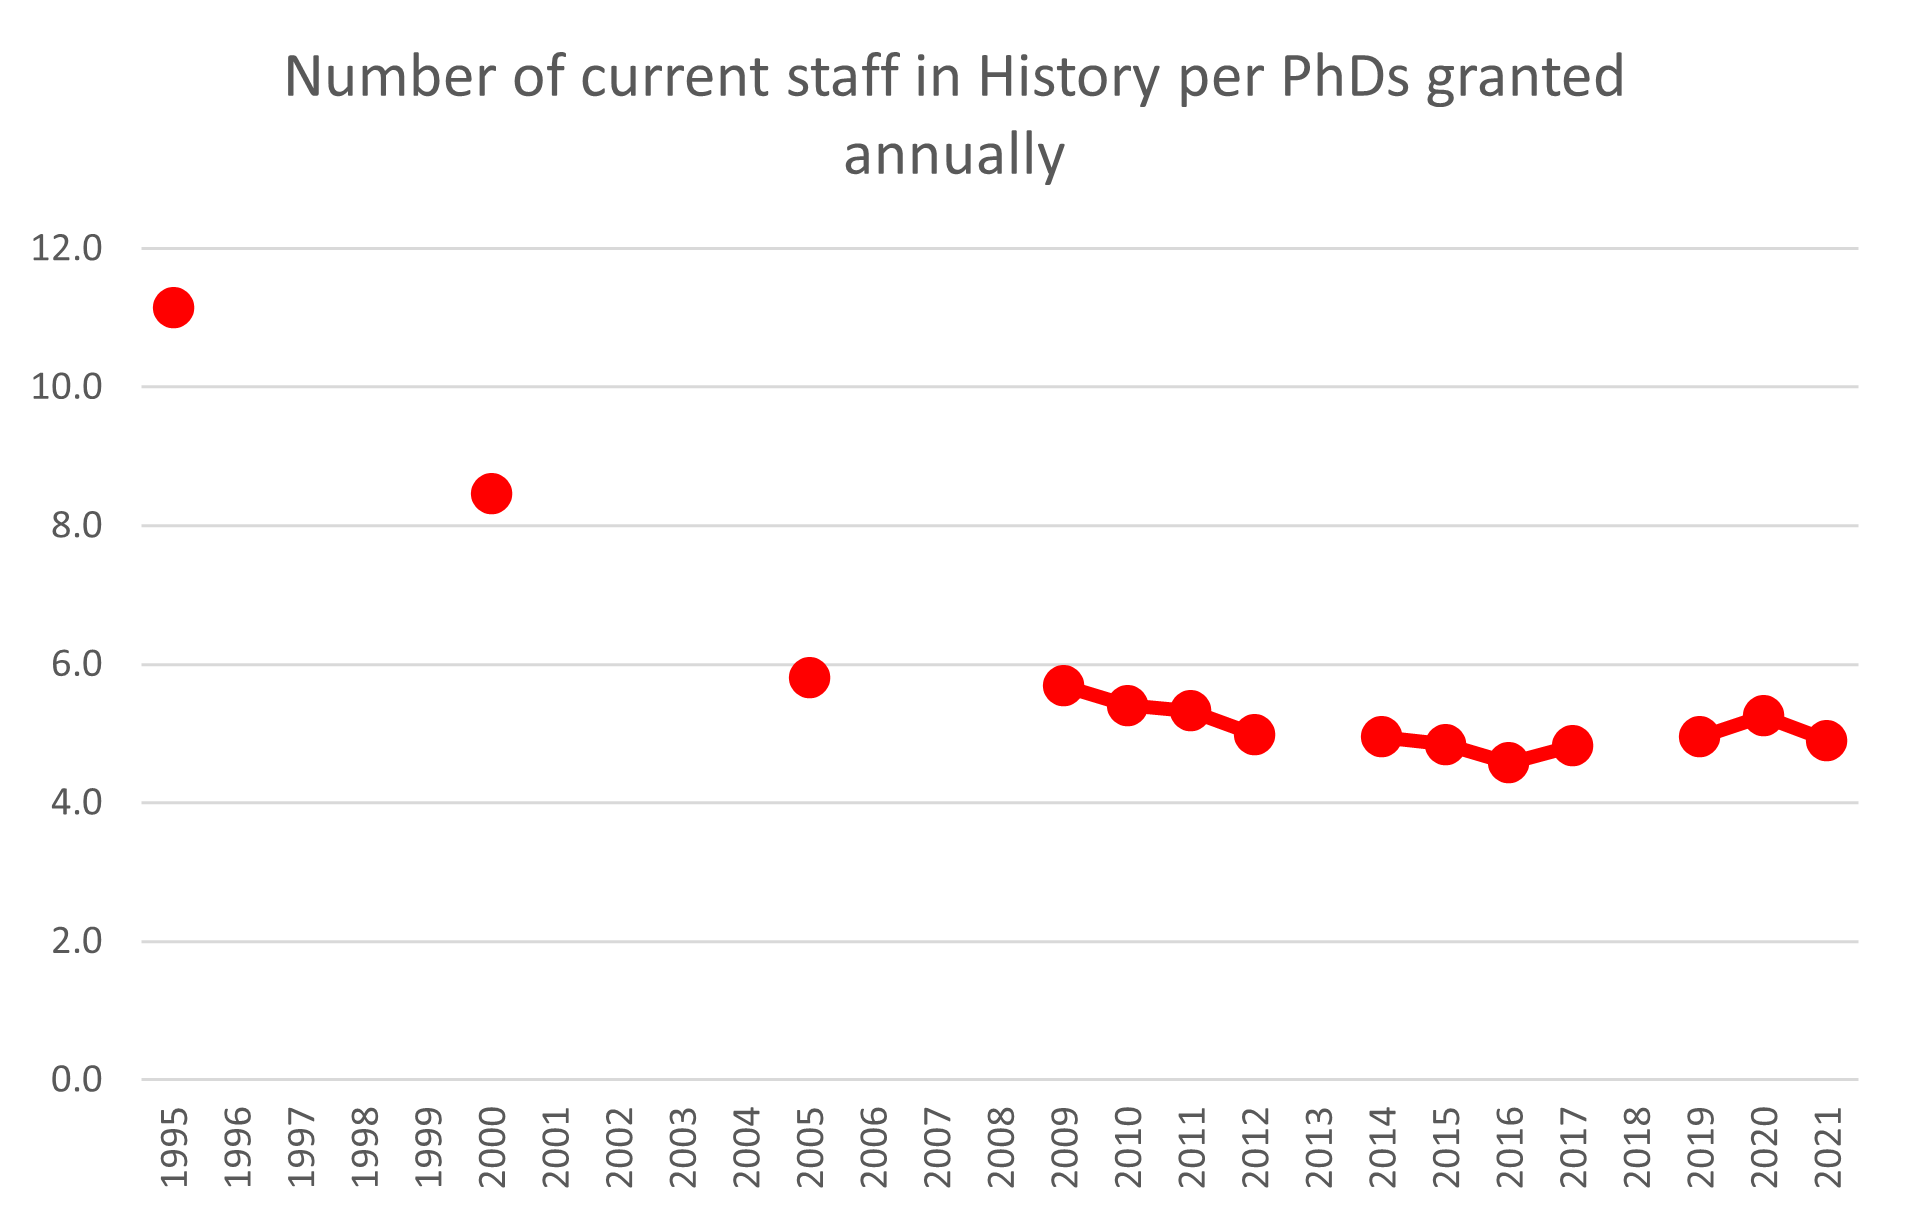
Ratio of historians in UK universities to PhDs awarded, 1995/96 to 2021/22
I’ll leave it to others offer their opinions on what this all means for the discipline of history in the UK. I’ve already published my thoughts on ‘what is to be done’. Although the Royal Historical Society and History UK are not doing everything I’d like them to, I know that they have limited resources and they are now addressing these issues in a more substantial way than they used to. I’d recommend their work on ‘Trends in History Provision in UK Higher Education’ (June 2022) and ‘Supporting History teaching and research in UK universities: a toolkit’ (updated January 2023).
For now, I’ll simply say: join the union and look out for each other, because the government and our employers aren’t going to.

V. interesting as usual. How far is this becoming a class issue for recruitment into academia? I suspect that there is no action dictated by ‘relevance’ like the dismissal of all medieval literature people in English at Leicester, but if there is, it wd be valuable to know. I do hope that there is no such targeting.
On a completely different matter, Lorna Finlayson in current LRB: https://www.lrb.co.uk/the-paper/v45/n06/lorna-finlayson/diary
IWGB is combating redundancies of hospitality and security staff which have been outsourced by UCL. Please write against this to: president.provost@ucl.ac.uk
Pingback: Six Axioms of Failure | Will Pooley
Pingback: Historians, PhDs and Jobs in 2026 | the many-headed monster