
Brodie Waddell
When I last wrote about the employment situation for historians back in 2023, the situation was not looking very bright. It has, however, somehow gotten much worse since then.
This short post is an attempt to share some basic data about the number of PhDs granted per year and the number of historians employed in UK universities, based on the figured published by the Higher Education Statistics Agency (HESA), which recently released its latest data up to 2024/25.
Before going further, I should note that the University and College Union branch at Queen Mary University of London has been doing the grim but invaluable work of collating reports of job losses across the sector on their UK HE Shrinking page, which includes much more recent evidence than the HESA data. I would also point readers to the Royal Historical Society’s page on Data on the UK Historical Discipline and Profession, which brings together valuable material.
There is now less solid information about the situation in the USA, though everyone will be aware of the terrible circumstances many historians are facing there. In my previous post, I noted that the American Historical Association had stopped publishing their Chart of Doom every year and now it seems they have even stopped issuing an annual Academic Jobs Report, which was last released in 2023.
The HESA data for the UK can be put into a simple spreadsheet and visualised as a chart of total staff employed in History in Higher Education, compared to the number of PhDs in History granted each year.
In 2024/25, there were 3,560 staff employed and 650 students awarded PhDs in History in UK universities.
(Note that the staff figures are for total number of people employed in this area on December 1st. The HESA data on full-time equivalents is more complicated, but for ‘academic (excluding atypical)’ FTE staff in History, the figure is 2,875 in 2024/25.)
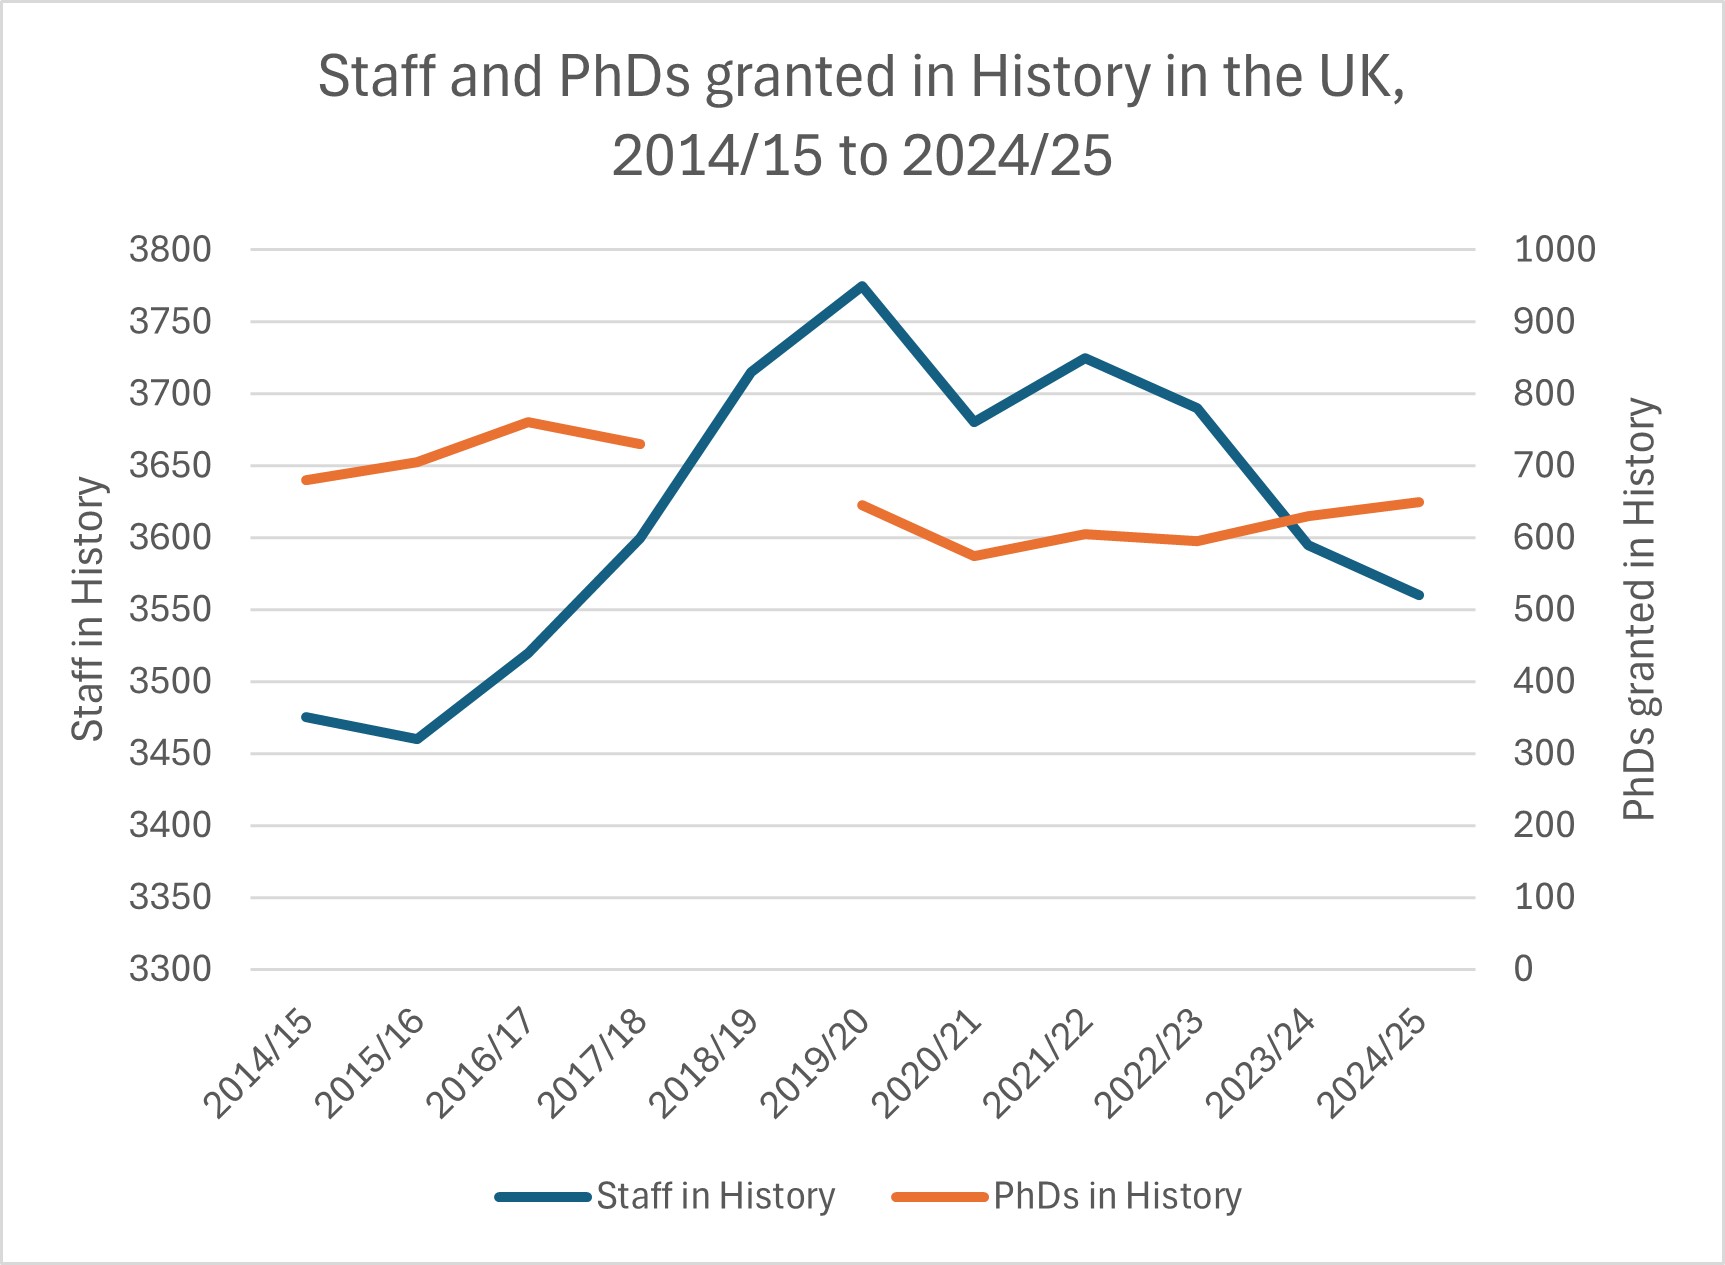
In the UK, the HESA data shows a few obvious trends. First, the number of staff in History rose fairly steadily from 2014/15 before peaking in 2019/20 and then mostly falling to the current low in 2024/25, the lowest number for about a decade. Second, the number of PhDs granted in History has bounced around each year since the mid-2010s rather than following a clear trajectory. Finally, the upshot of those two patterns is that the number of current staff per new PhD has reached the worst ratio since at least 2019/20. One PhD was awarded for every 5.5 current History staff in 2024/25.
As with my previous update, I’ll end by simply saying join the union and look out for each other, because the government and our employers aren’t going to.
I have put the raw data into an Excel spreadsheet:
Please link to this blog post to provide context if sharing the chart or data.
Postscript, 21/05/2026: The American Historical Association just published ‘The 2025 Academic Jobs Report’. It notes that: ‘recent estimates of the number of history faculty at two- and four-year institutions by the US Bureau of Labor Statistics (BLS) shows a decline of 16 percent from 2015 to 2024, and an analysis of full-time faculty listed in the AHA’s Directory of History Departments shows a decline of 13 percent from 2010 to 2025’. So the number of staff in history departments in the USA seems to have peaked in 2015 according to one measure or 2010 according to another measure. Meanwhile, ‘the number of tenure-line jobs advertised with the AHA Career Center last year fell to the smallest number since the pandemic’. So hiring has also been falling for the last five years and, excluding the pandemic, is at the lowest level in a decade.
